How observability fights against the chaos of the IS (and makes the fortune of publishers)


Did you think that the rise of cloud computing and containers would simplify your life as a CIO and that of your teams? At what point did you realize that this was not true? That, on the contrary, decentralized computing blurred the vision of your IS? Was causing real chaos?
Well, this big bazaar is the business of the kings of observability, including Dynatrace which organized a European event at the beginning of October.
“We put order in the chaos” enthuses Rick McConnell, the CEO of Dynatrace, on stage. “We are moving towards a great complexity in the design and maintenance of computer systems. We address the complexity of these systems”.
The European observability market is worth $50 billion
And this proposal seems to be meeting with important echoes. The European observability market is $50 billion. And the Gartner firm has introduced observability for the first time in its 10 main strategic technological trends for the year 2023.
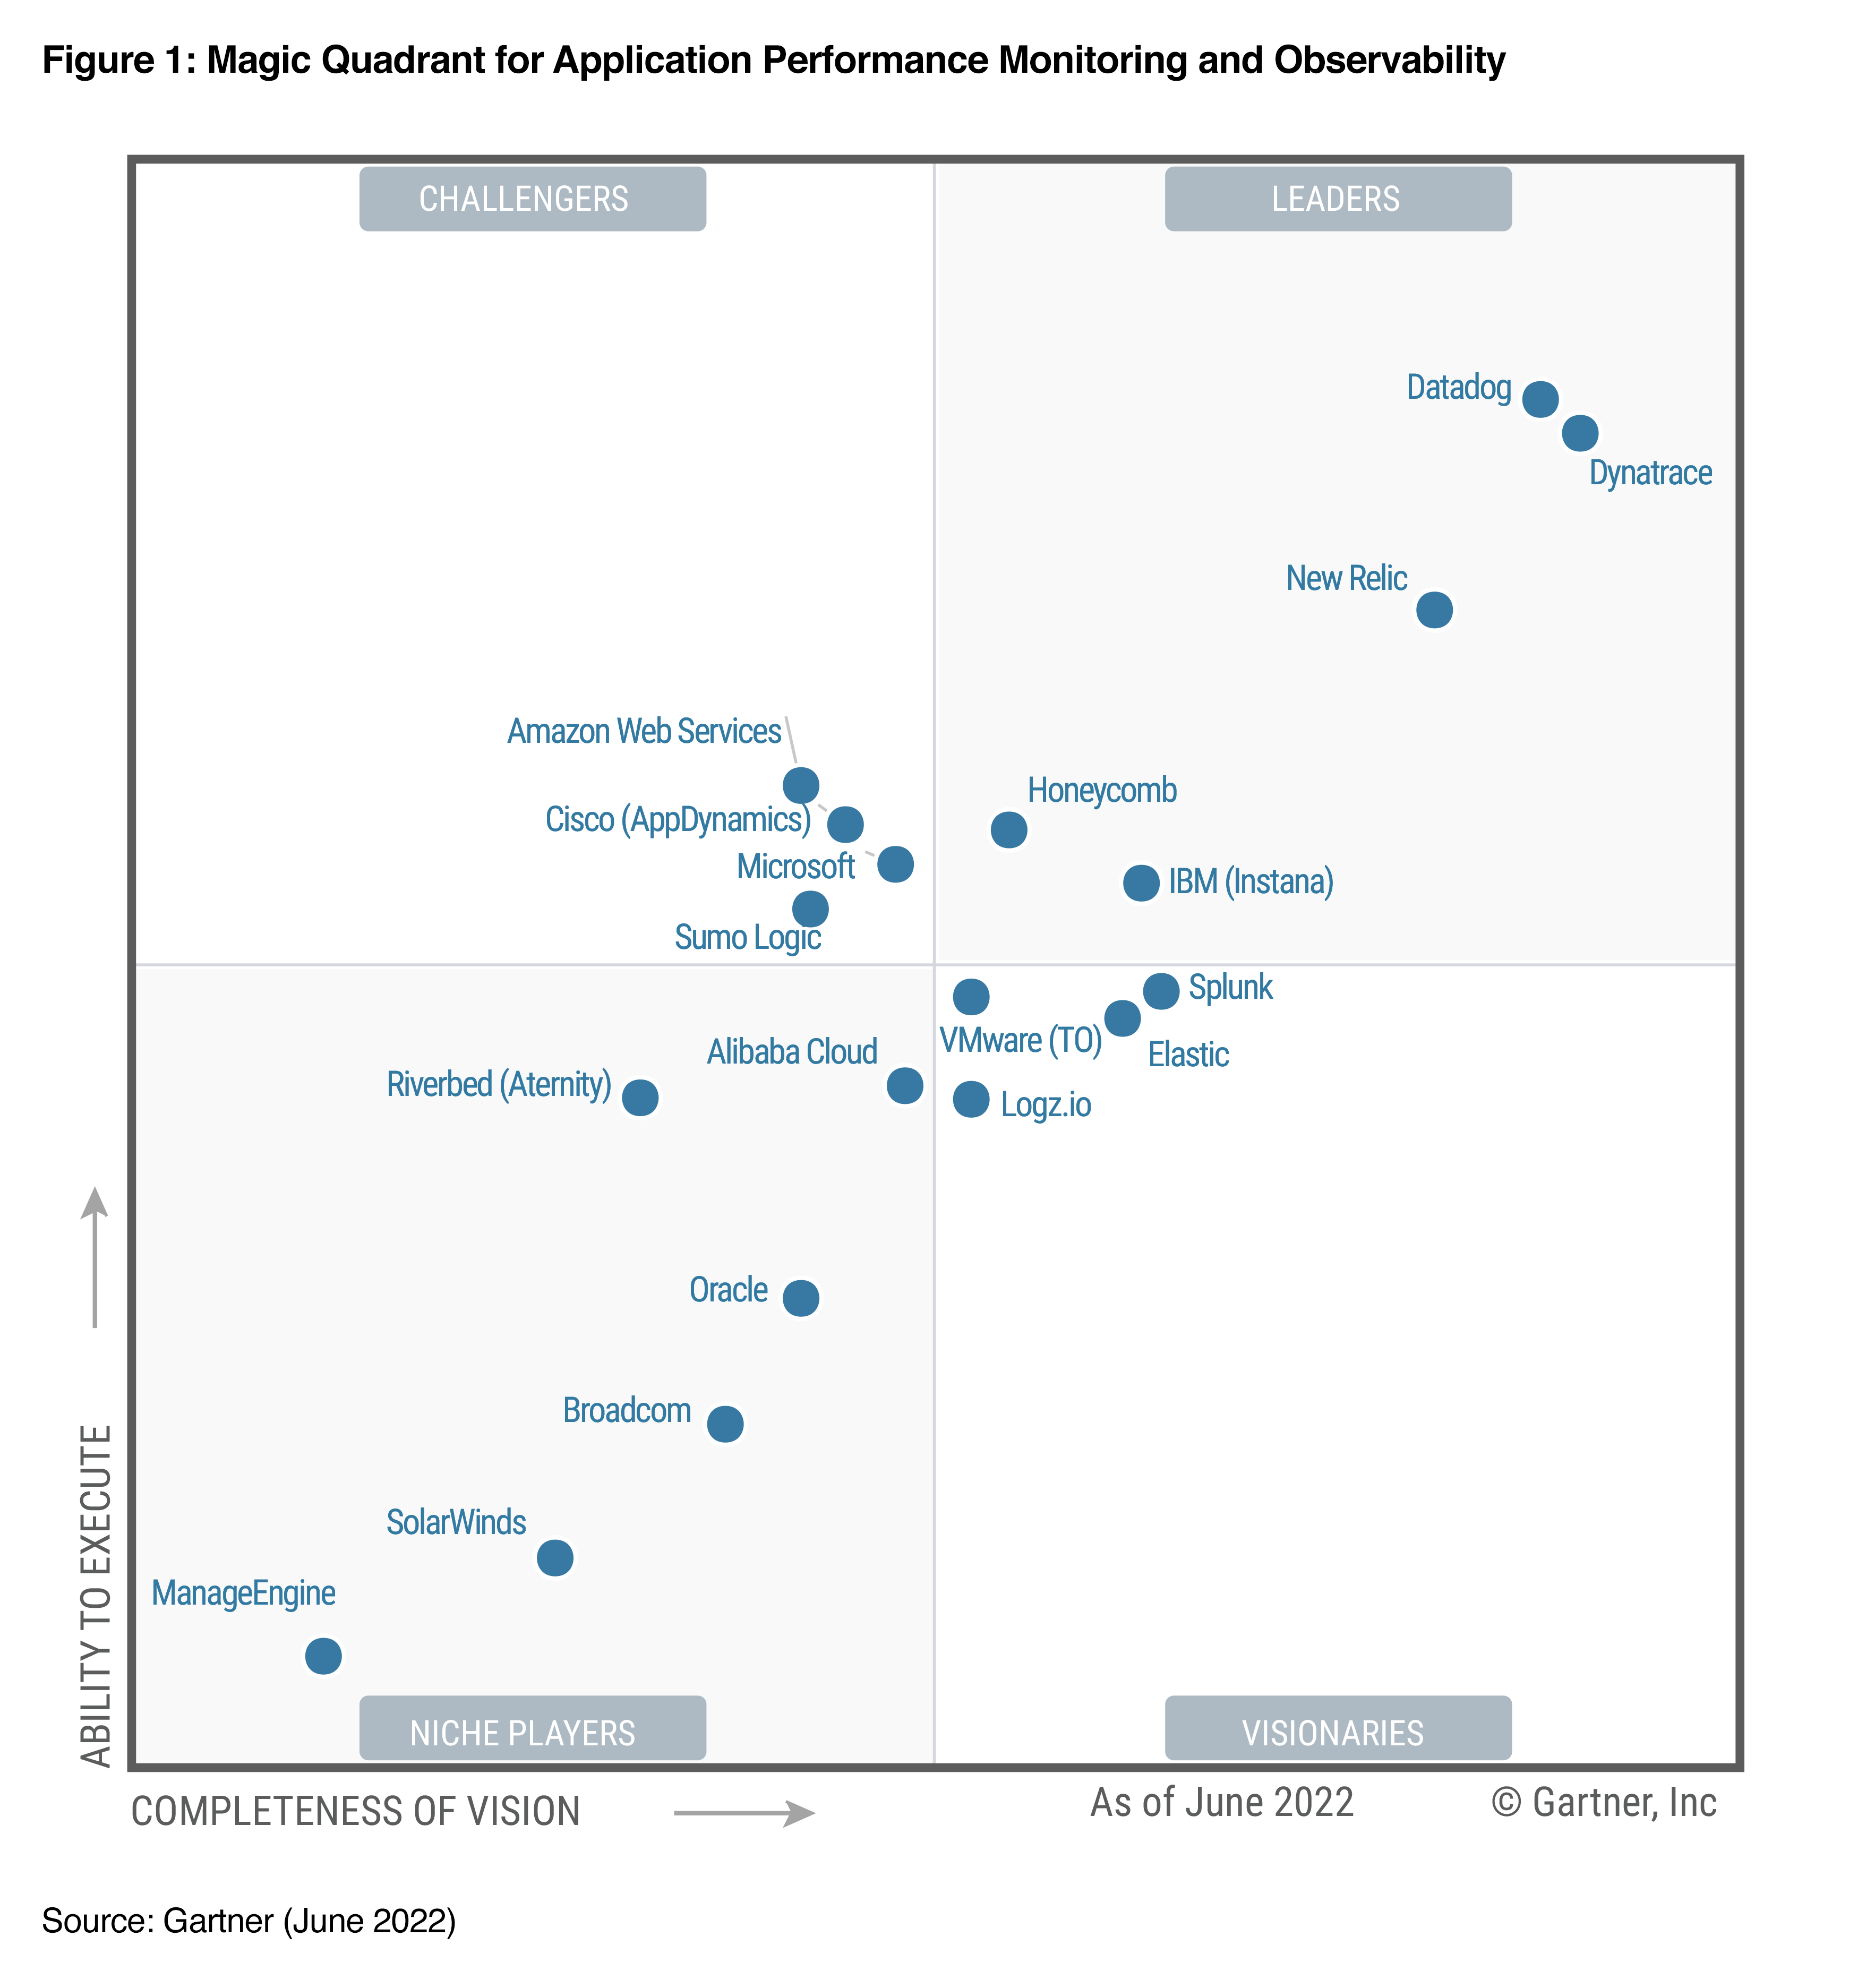
Gartner counts specialized players on the observability market,
like Dynatrace, New Relic and Datadog, but also generalists who
develop specific bricks, such as IBM (with Instana), Oracle
(with Application Performance Monitoring) or Cisco (with
AppDynamics).
This sector for Gartner is that of APM (Application Performance Monitoring) and Observability. There are specialized players, such as Dynatrace, New Relic and Datadog, but also generalists who develop specific bricks, such as IBM (with Instana), Oracle (with Application Performance Monitoring) or Cisco (with AppDynamics).
“It’s when the applications don’t work that the market grows,” emphasizes Rick McConnell. And why are the applications no longer working? “It is becoming easier and easier to develop and deploy applications,” says the Dynatrace boss. But this dynamic encounters limited human resources and a great degree of entropy”.
Of AI to fight against the entropy of AI
“More and more code is being produced, but it’s not necessarily good quality code,” agrees Bernd Greifeneder, the company’s Technical Director. “Tools like Copilot raise concerns from this point of view”.
“When the IT department has to manage 5 releases a day, no one can guarantee the quality and security of the code by anything other than observability,” he assures.
So what to do? Dynatrace proposes to use AI to fight against the drifts of AI!
Its AI has been used for more than 10 years, for detection but also prediction. The novelty? Generative AI of course, which allows “to better interrogate these tools”. Dynatrace uses Gen AI to generate queries and dashboards. Everything is packaged under the commercial name of Davis AI.
But beyond its first job, the observability of the DevOps layer, the chaos in information systems gives wings to Dynatrace, which now evokes a unified platform. “Observability and cybersecurity are convergent. Cybersecurity automation is still in the Stone Age,” notes Bernd Greifeneder. “We also have plans to move towards network observability. We have an in-house technology for this” completes Rick McConnell.
A definition of the observability of information systems
Observability? A concept that differs, or complements, or even merges, with that of surveillance (monitoring), according to experts. Supervision (monitoring) is a process of collecting, analyzing and using information from the physical and software equipment that makes up the IS. The analysis of this process makes it possible to monitor the behavior of a program, to detect malfunctions and to guarantee its operation.
Observability allows is the ability to understand the internal state of a system by analyzing data such as logs, traces, API calls, waiting time, downloads or file transfers.
In short, observability helps IT teams analyze what is happening in the IS to detect and solve problems. To understand what is happening inside a system, observability relies on its logs, its metrics and its traces.
- The logs (the logs) applications and systems provide historical details about operations and flows.
- The metrics measure a value at a specific moment in time. It can be, for example, the CPU utilization rate.
- Finally, the traces represent the path of user or application interactions in the system. Distributed tracing for its part, it is a diagnostic technique that consists of observing requests as they move in distributed environments, such as cloud computing instances. In these complex systems, this makes it possible, for example, to highlight the performance problems of microservices.
You May Also Like


More From Author

ServReality Brings Next-Gen Gaming Experiences to Apple Devices
January 23, 2026


The Top 25 Diamond and Pearl Pokémon
August 5, 2024